好書介紹:The Toyota Product Development System
這是豐田模式(The Toyota Way) 作者 Jeff. Liker的另一力作﹐談論豐田的新產品開發系統 ﹐是有心改善新產品開發流程的讀者﹐不可錯過的好書﹐國內有翻譯本!
本筆記是由一群工程師同好所建立 歡迎留言 或發信給管理者: demingtw2@gmail.com
這是豐田模式(The Toyota Way) 作者 Jeff. Liker的另一力作﹐談論豐田的新產品開發系統 ﹐是有心改善新產品開發流程的讀者﹐不可錯過的好書﹐國內有翻譯本!
Coordinate Measuring Machine, CMM 在台灣業界,我們一般稱之為三次元測量儀。
以下則是摘錄自wikipedia的說明。
A 'coordinate-measuring machine' (CMM) is a device for dimensional measuring. It is a machine that is used to move a measuring probe to obtain the coordinates of points on an object surface. These machines are used to measure the dimensions of target objects. Often these parts have tolerances as small as .0001". The machine uses an X-Y-Z grid to determine its position on a worktable. The probe is used to touch different spots on the part being measured. The machine then uses the X,Y,Z coordinates of each of these points to determine size and position. There are newer models that have probes that drag along the surface of the part taking points at specified intervals. This method of CMM inspection is more accurate than the conventional touch-probe method and most times faster as well. The next generation of scanning, known as laser scanning, is advancing very quickly. This method uses laser beams that are projected against the surface of the part. Many thousands of points can then be taken and used to not only check size and position, but to create a 3D image of the part as well. This "point-cloud data" can then be transferred to CAD software to create a working 3D model of the part. The laser scanner is often used to facilitate the "reverse engineering" process. This is the process of taking an existing part, measuring it to determine its size, and creating engineering drawings from these measurements. This is most often necessary in cases where engineering drawings may no longer exist or are unavailable for the particular part that needs replacement.
A coordinate measuring machine (CMM) is also a device used in manufacturing and assembly processes to test a part or assembly against the design intent. By precisely recording the X, Y, and Z coordinates of the target, points are generated which can then be analyzed via regression algorithms for the construction of features. These points are collected by using a probe that is positioned manually by an operator or automatically via Direct Computer Control (DCC).
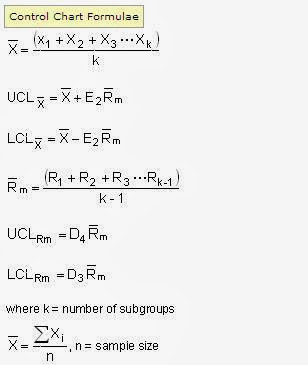
所謂Individuals and Moving-Range Charts ﹐我們稱之為X-Rm管制圖分析( X-Rm Control Chart)﹐應用在抽樣數為1 (每日一件 甚至每月一件等狀況) 之環境。
也有稱之為 I-MR Chart 的說法,與X-Rm管制圖分析( X-Rm Control Chart)說的是同一個管制圖。
X-Rm管制圖由個別值管制圖與移動全距管制圖組成
所謂移動全距為樣本值與前次樣本值之差﹐Ri = | Xi - X i-1|
相關管制界限的計算公式如下:
X-Rm管制圖乃X-bar R管制圖的延伸﹐其管制界限之計算不變﹐但n=2
因此下表中的 E2與D4 可分別計算查表 求出 E2 = 2.66, D4 =3.27
參考資料:
http://www.isixsigma.com/control_charts/individuals_and_moving_range_control_chart.asp
http://www.sqc.com.tw/Function/X-Rm.htm
http://en.wikipedia.org/wiki/Operations_research
Operations Research (OR) in the US, and Operational Research in the UK, is an interdisciplinary branch of applied mathematics which uses methods like mathematical modeling, statistics, and algorithms to arrive at optimal or good decisions in complex problems which are concerned with optimizing the maxima (profit, faster assembly line, greater crop yield, higher bandwidth, etc) or minima (cost loss, lowering of risk, etc) of some objective function. The eventual intention behind using operations research is to elicit a best possible solution to a problem mathematically, which improves or optimizes the performance of the system.
Enumerative Study:計數型研究
Analytic Study: 分析型研究
這兩種研究特性不同,適用的方法也不同。絕大部份改善問題之探討,屬於分析型之問題探討。
計數型探討的目的是估計一個清單內屬於某一特定類別(Specified Class)之個體數目,以作為對一個靜態母體之決策或行動基礎。例如探討在某一區域之居民數及食物存量以決定食物之適當進口量,分析煤樣品質以決定某一船煤炭之合理價格,研究某一產品在市場之佔有率以作為行銷之基礎…等等。這種探討是敘述性的,其目的是回答「有多少」的問題,而非「為何多,為何少」的問題。
分析型探討之目的在於對產生清單之因果系統或程序,提供未來改善之行動基礎。例如決定某一地區之稻米產量為何偏低,未來如何增產;比較兩種機器之生產力,以決定那一種機器比較好;改變溫度、壓力、進料對化學反應產率、純度之影響… 等等。這類分析型探討之焦點是未來而非現在,所要回答的是屬「為何、如何」這類的問題。
參考資料:
1. 由戴明理念談實驗設計之應用 中國石油公司煉製研究所研究員 蔡坤祥
2. When Statistics Meet Reality Davis Balestracci
